

Summary
This article explores the pivotal role of timeouts in the NBA, highlighting their strategic importance for teams looking to gain a competitive edge. Key Points:
- NBA coaches utilize timeouts strategically for adjustments, player fatigue management, and momentum shifts.
- Data analytics empowers coaches to optimize timeout strategies by identifying player patterns and opponent tendencies.
- AI algorithms can analyze real-time data to inform timeout decisions, enhancing game strategy based on various factors.

Timeouts play a crucial role in managing gameplay during NBA matches. Coaches strategically call timeouts to plan their next possession, maintain or shift the team's momentum, reorganize offensive or defensive strategies, and even contest referees' calls. It's not unusual for fans to voice their dissatisfaction regarding a coach's choice of when to take a timeout. A quick look on Twitter using terms like "Ham timeout" and "Malone timeout" reveals numerous tweets reflecting this sentiment:
Key Points Summary
- Mandatory timeouts are 2:45 for local games and 3:15 for national games.
- Teams can use a total of seven timeouts during a game, with a maximum of four in the fourth quarter.
- Coaches use timeouts to strategize and communicate important instructions to players.
- Television timeouts are breaks specifically designed for broadcasting purposes during live events.
- The Coach`s Challenge allows teams to request replay reviews for specific plays, such as out-of-bounds violations.
- In critical game moments, lacking timeouts can severely limit a team`s options.
Timeouts in basketball play a crucial role not just for strategy but also for the flow of the game. Whether it`s mandatory pauses or TV breaks, they offer teams opportunities to regroup and rethink their approach. It`s interesting how these little moments can change the course of an entire match, especially when every second counts.
Extended Comparison:| Aspect | Local Game Timeouts | National Game Timeouts | Total Team Timeouts | Timeouts in Fourth Quarter | Impact of Not Having Timeouts |
|---|---|---|---|---|---|
| Duration | 2:45 minutes | 3:15 minutes | 7 total timeouts per game | Maximum 4 timeouts allowed | Limited strategic options during crucial moments |
| Purpose of Timeout | Strategizing and instruction from coaches | Strategizing and instruction from coaches | Breaks for team discussions and adjustments | Opportunity to rest players or disrupt opponent's momentum | Can cost games if mismanaged |
| Television Timeout Characteristics | Specific breaks for broadcasting needs | Specific breaks for broadcasting needs | Part of the overall timeout management strategy | Ensures fluidity in televised coverage while affecting gameplay rhythm | Influences team strategies based on broadcast timing |
| Coach's Challenge Use Cases | Review out-of-bounds violations, fouls, etc. | Review out-of-bounds violations, fouls, etc. | Allows teams to contest specific referee calls | Provides teams an opportunity to overturn critical decisions in tight games | Could be a game-changer in final moments when every point matters |


Leveraging Data Analytics to Optimize Timeout Usage in Sports
"**1. Identifying Optimal Timeout Moments using Play-by-Play Data:** A crucial aspect of game strategy involves pinpointing the most effective moments for a timeout, particularly during what can be classified as 'opponent runs.' By leveraging play-by-play (PBP) data, teams can develop sophisticated statistical models that identify patterns indicative of such runs. This includes analyzing metrics like scoring bursts, opponent field goal percentages, and sequences of possessions where the opposing team appears to gain momentum. The result is the development of run-detection algorithms capable of signaling when a timeout could be tactically advantageous. ","**2. Coach-Specific Timeout Patterns & Success Metrics:** In addition to PBP data, integrating coach-specific insights from scouting reports and historical analysis on timeout usage offers a broader perspective on their effectiveness. By examining these diverse data sources collectively, one can create comprehensive metrics that measure the impact of timeouts beyond immediate score changes. This analysis might reveal how often a timeout facilitates successful defensive adjustments, alters offensive strategies, or shifts game momentum in favor of the team."

I conducted an analysis of Play-by-Play (PBP) data sourced from nba.com, utilizing the Python library nba_api. This examination focuses primarily on timeouts called by coaches to interrupt opposing teams' scoring runs, which is why only the first three quarters of each game are included in the dataset. Timeouts taken during the final moments of a game serve different strategic purposes. In total, the dataset recorded 37,434 timeouts; among these, 32,830 were initiated by teams that were not on a scoring run. Notably, out of those timeouts called by non-run teams, 21,649 effectively disrupted their opponents' momentum.

Calling a timeout effectively halts the opposing team's momentum approximately 66% of the time, based on data from 21,649 out of 32,830 instances. In this analysis of timeouts, I will introduce a new variable derived from play-by-play data: runs. Runs refer to periods where one team scores uncontested points in succession. When we examine all such scoring stretches (excluding the fourth quarter and overtime) for the NBA's 2023-24 season, it becomes clear that most runs consist of just one scoring possession before the opposing team responds.

Let's explore the connection between victories and scoring after a timeout. In particular, I focused on how effectively teams generate points following a timeout when they are not currently experiencing a scoring streak.


The following table showcases teams that excel in scoring runs after timeouts (ATO) when compared to their typical run performance.

The data reveals that the Miami Heat appears three times (19, 20, 21) in the top 10 teams that have exceeded their average run length. This highlights Erik Spoelstra's effective use of ATO (after-timeout) strategies and his timely timeouts. I proposed that stronger teams are more adept at stopping opposing runs compared to weaker ones. To validate this idea, I examined the correlation between win percentage and instances of halted runs, resulting in a Pearson correlation coefficient of .30. This indicates a weak relationship between these two factors.

df['scoring_rate'] = (((df['home_score']-df['previous_run_home_score']) -(df['away_score']-df['previous_run_away_score']))/df['time_spent_run']).fillna(0)
Now, let's investigate whether there is a notable difference in the average characteristics between timeouts that effectively stopped scoring runs and those that fell short.

The analysis reveals that the duration of previous scoring runs—whether made by our team or the opposing side—remains consistent regardless of whether timeouts are called during halts or non-halts, as well as home versus away games. Nonetheless, there is a noticeable difference in scoring efficiency and net point differentials, particularly suggesting that requesting a timeout when the point spread is narrow can be an effective strategy to halt an opponent's momentum.
To assess whether significant differences exist between two groups across various features, I employed the Mann-Whitney U test. This non-parametric statistical method is ideal for comparing distributions without the need for normality assumptions. I specifically applied this test to analyze both home timeouts and away timeouts, considering the variations in values (given that net difference and scoring ratios favor the home team) as well as evaluating each feature individually for two categories: timeouts that disrupted a run and those that did not.
To tackle the challenge posed by the extensive range of features examined, I implemented the Bonferroni correction to manage the issue of multiple comparisons. This technique modifies the significance threshold by dividing it by the total number of tests conducted, effectively reducing the likelihood of Type I errors, commonly known as false positives. By employing both the Mann-Whitney U test and this correction method, we established a solid framework for detecting statistically significant differences between groups, thereby ensuring that our results are both robust and trustworthy.
The table below outlines the findings from the statistical analyses performed on all relevant features. The "Rejection" column indicates whether we have dismissed the null hypothesis, which posits that the distributions of these features remain consistent across both groups. Notably, we can see that the scoring ratios and net differences in distributions are statistically distinct between the two groups—those with halts and those without—regardless of whether it pertains to home or away timeouts.


Coaches often utilize multiple timeouts during a game, which means these timeouts are interconnected rather than isolated events. Each coach brings their own distinct approach to managing these pauses in play. In this analysis, we focus solely on the timeouts called by teams that are not currently experiencing a scoring surge. To accurately capture the influence of coaches who may call several timeouts, I used a multilevel logistic model. This method allows us to factor in the variability associated with each coach’s decisions, while also addressing our binary outcome variable—whether or not a timeout effectively halted the opposing team's run.
After selecting the random effects variable, I proceeded to identify the fixed effects variables. I opted to include several of the variables we examined during our exploratory data analysis, such as the net run differential, scoring ratios for both the prior two runs and the current run, as well as the win percentage of each team taking a timeout. My intention is to analyze the variance attributed to different coaches in order to assess which coach has a more significant impact on interrupted runs. The coefficients associated with fixed effects will reveal how various factors at the moment of a timeout influence halted runs—whether they enhance, diminish, or have no effect at all. To address the discrepancies between home and away timeouts, I developed two distinct models:
In the model, βX signifies the fixed effects, while Qq denotes the random effects attributed to coaches.

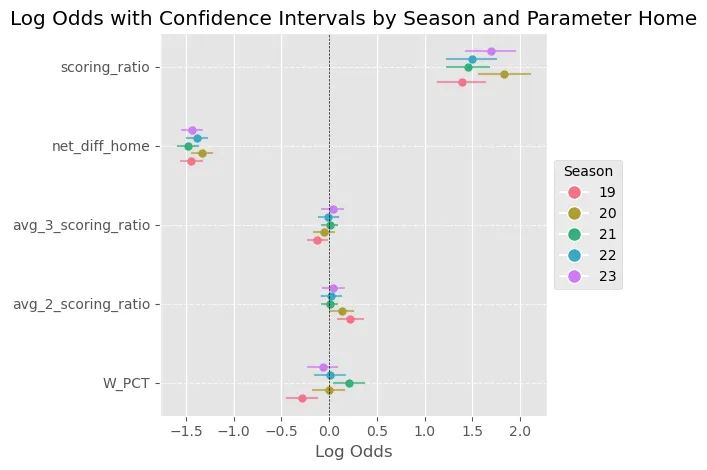
This chart illustrates the estimated fixed effects from both models, differentiated by season. Since these estimates are presented on a log-odds scale, values above zero indicate an increase in halted runs, while those below zero suggest a decrease. Estimates that hover around zero imply no significant effect on batted passes. Variables with confidence intervals that include zero may not influence halted runs at all. Notably, only the scoring ratio for the current run and net differences consistently show significant results across both models and all years.
Random Effects models are a powerful tool in the realm of statistics, particularly when analyzing data that involves multiple levels of variability. These models allow researchers to account for both fixed and random factors, providing a more nuanced understanding of the relationships within the data. By incorporating random effects, analysts can better capture the complexities inherent in hierarchical or grouped data structures, leading to more reliable conclusions.}
{In essence, Random Effects models help to address the issue of correlation within clustered data. For instance, when observations are gathered from different groups—such as students from various schools or patients from different hospitals—these models recognize that there may be unobserved factors at play that influence the outcomes. This way, they enhance the accuracy of predictions by acknowledging these underlying variations rather than assuming each observation is entirely independent.}
{Moreover, employing Random Effects allows for greater flexibility in statistical modeling. It enables researchers to explore how certain variables might affect outcomes differently across various contexts or populations without losing sight of individual group characteristics. This adaptability makes it an invaluable approach for fields like sports analytics where performance metrics can vary widely based on numerous external influences such as team dynamics and coaching styles.}
{Ultimately, utilizing Random Effects models not only improves analytical robustness but also enriches our interpretation of complex datasets. By considering both fixed and random influences, we gain deeper insights into patterns and trends that would otherwise remain obscured in simpler analytical frameworks. This comprehensive perspective is essential for making informed decisions based on multifaceted information found in today’s diverse datasets.
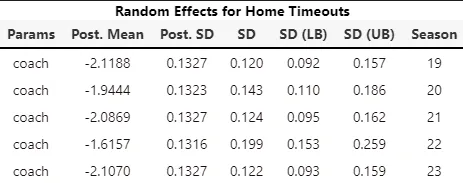

Analysis reveals that the variability attributed to coaches remains stable over the years, with confidence intervals consistently excluding zero. This suggests that differences in strategies regarding timeout usage among coaches may indeed account for some of the observed variance.

This table highlights the leading and trailing six coaches for the 2023–24 season. It reveals some fascinating dynamics: while Michael Malone's Denver Nuggets are recognized as a strong team, their overall rating is surprisingly low. In contrast, Jacque Vaughn's Brooklyn Nets, who have struggled significantly this season, find themselves at the top of this list.

Future investigations could delve into the lasting effects of timeout strategies on a team's overall performance, examine specific plays executed following timeouts, or assess how the effectiveness of these timeouts shifts during high-stakes games such as playoffs. This research lays a data-backed groundwork for NBA coaches and analysts to reevaluate and potentially refine their timeout tactics, which might lead to small improvements that could prove crucial in tightly contested matches. Thank you for your attention.
References
RULE NO. 5: Scoring and Timing
Mandatory timeouts shall be 2:45 for local games and 3:15 for national games. Any additional team timeouts in a period beyond those which are mandatory shall be ...
Source: NBAOfficialHow do timeouts work in the NBA? All you need to know
Head coaches use timeouts to halt play in order to communicate with their players and give out instructions that could affect the game's outcome.
Source: SportskeedaHow many timeouts does each team have in an NBA game? - AS USA
During game time, both teams are allowed seven timeouts in total, except for being entitled to not more than four timeouts in the fourth quarter ...
Source: Diario ASWhat is a TV timeout, and what are the rules surrounding it (if there are any)?
Is this a thing? I feel like I've heard commentators reference the TV timeout quite a lot. Is it a requirement that a team takes a timeout within the first ...
Source: RedditRULE NO. 14 – Coach's Challenge
A Coach's Challenge is the only mechanism to trigger replay review of out-of-bounds violations at any point during the game.
Source: NBAOfficialTelevision timeout
A television timeout (alternately TV timeout or media timeout) is a break in a televised live event for the purpose of television broadcasting.
Source: WikipediaIn the NBA, 20 seconds can last 20 minutes in real time. That needs to ...
It's not just fouls that are a problem though. In the NBA, each team is allowed seven timeouts per game. That's 14 stoppages in a game where ...
Source: The GuardianHow losing a timeout to request a coach's challenge can alter ...
In the final seconds, when Jamal Murray hit what became the game winning shot, the Lakers had 3.6 seconds. With no timeouts left, they had to go ...
Source: Pounding The Rock
 ALL
ALL sports
Discussions