Summary
This article explores the importance of analyzing Zone 14 and half-space in football using Python, providing valuable insights for both beginners and enthusiasts alike. Key Points:
- Zone 14 and half-space are crucial areas in football that significantly influence team strategy, player positioning, and play development.
- Using Python libraries like Pandas, NumPy, and Scikit-learn enables advanced analysis of key performance indicators such as pass completion rates within these zones.
- Data visualization with tools like Matplotlib or Seaborn helps identify patterns in player movement and passing options, enhancing tactical insights.

Key Points Summary
- Half spaces are the vertical zones between the central lane and wide areas on a football pitch.
- They create opportunities for players to pass at angles that can catch the defense off guard.
- These areas allow creative players to exploit dangerous angles for attack.
- Half spaces combine the advantages of both central and wide play, enhancing attacking options.
- Derived from the German term `Halbraum`, this concept has gained popularity in modern football tactics.
- Positions in half spaces provide players with multiple options without being restricted to straight lines.
Understanding half spaces can really change how we appreciate football. These zones aren`t just about where you stand; they dictate how teams attack and defend. By using these areas wisely, teams can create more scoring chances while keeping their opponents guessing. It`s fascinating how something as simple as positioning can have such a big impact on the game!
Extended Comparison:| Aspect | Central Play | Wide Play | Half Space |
|---|---|---|---|
| Angle of Attack | Straightforward, predictable | Flank-based, limited angles | Dynamic, versatile angles |
| Player Positioning | Constrained to central roles | Wingers and full-backs often isolated | Midfielders can drift in/out, multiple options |
| Defensive Response | Easier for defenders to track movements | Requires wide defensive coverage, creating space elsewhere | Creates confusion; defenders may need to choose which player to mark |
| Creative Opportunities | Limited creativity due to rigidity in positioning | Crosses from wide areas can be effective but often lack precision in attack phase | Allows for intricate passing and unexpected movement patterns |
| Modern Tactical Trends | Less favored in high-press systems | Utilized for counter-attacking play | Emphasized by teams like Manchester City and Barcelona |
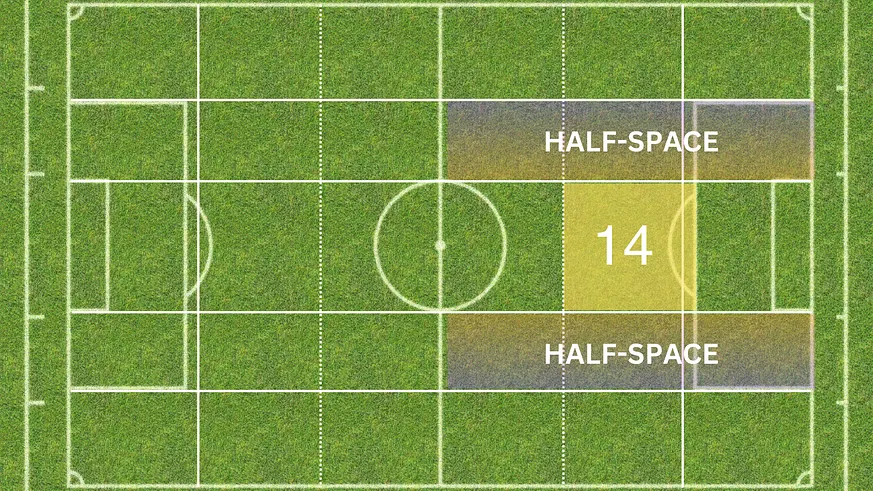
Zone 14, located just outside the opponent's penalty area, is widely recognized as a pivotal region where attacking maneuvers are often focused. This designation comes from its classification as the 14th segment in a typical football pitch division. The significance of this area cannot be overstated, as it frequently serves as the launching point for key passes, shots on goal, and other critical plays, making it a prime target for analyzing offensive strategies.
Half-spaces refer to the zones situated between the central and wide areas of the pitch. These regions lie just outside the core but are not entirely pushed out to the sidelines. Utilizing these spaces is crucial for generating numerical advantages and taking advantage of weaknesses in an opponent's defense. Teams that masterfully navigate these areas often gain a significant edge when trying to dismantle well-structured defensive setups.
By examining passes into Zone 14 and Half-Spaces, teams can gain valuable insights into their offensive strategies and strengths. For coaches and analysts, this information allows them to fine-tune their tactics to make the most of these vital areas on the pitch. Meanwhile, fans and commentators benefit from a clearer understanding of the game's dynamics and which zones play a pivotal role in determining a team's success.
Now, let’s break it down: First, you’ll need to install and import essential Python libraries. We utilize mplsoccer for creating football pitch diagrams, alongside pandas for data manipulation, matplotlib for plotting visualizations, as well as json and re for extracting relevant data.
!pip install mplsoccer import re import json import pandas as pd import matplotlib.pyplot as plt from mplsoccer import VerticalPitch import matplotlib.patches as patchesmplsoccer: Offers a suite of tools designed for drawing football pitches and visualizing match data. pandas: Specializes in data manipulation and analytical processes. matplotlib: Facilitates the creation of diverse plots and visual representations. json and re: Assist in the parsing and extraction of information from JSON files and HTML documents. Frequently, data from football matches is integrated within HTML files in a format resembling JSON. Our objective here is to utilize regular expressions to extract this information and convert it into a standard JSON format.
def extract_json_from_html(html_content, save_output=False): pattern = r'(?<=require\.config\.params\["args"\].=.)[\s\S]*?;' data_txt = re.findall(pattern, html_content) if data_txt: data_txt = data_txt[0].replace('matchId', '"matchId"')\ .replace('matchCentreData', '"matchCentreData"')\ .replace('matchCentreEventTypeJson', '"matchCentreEventTypeJson"')\ .replace('formationIdNameMappings', '"formationIdNameMappings"')\ .replace('};', '}') if save_output: with open("output.json", "wt", encoding='utf-8') as output_file: output_file.write(data_txt) return data_txt print("No JSON-like data found.") return NoneTo locate and extract JSON-like data from HTML, we utilize a Regular Expression Pattern. Following this, we implement Replace Statements to ensure that the extracted text is transformed into a valid JSON format. Additionally, there is an option to save the cleaned-up JSON data into a file for future use. Once we have acquired the JSON data, our next steps involve reading it, parsing it appropriately, and converting it into a Python dictionary.
html_path = r'/content/Turkiye 0-3 Portugal - European Championship 2024 Live.html' with open(html_path, 'r', encoding='utf-8') as file: html_content = file.read() json_data = extract_json_from_html(html_content, save_output=True) if json_data: try: data = json.loads(json_data) except json.JSONDecodeError as e: print(f"Error decoding JSON: {e}")To begin, we load the HTML content from a specified file. Next, we utilize a function designed to extract JSON data from this HTML. Once we have the JSON string, we convert it into a Python dictionary while carefully managing any potential decoding issues that may arise. After successfully parsing the JSON data, we proceed to gather essential information such as event specifics and player details. Finally, this valuable data is organized and saved into CSV files, paving the way for in-depth analysis later on.
def extract_data_from_dict(data): events_dict = data["matchCentreData"]["events"] teams_dict = { data["matchCentreData"]['home']['teamId']: data["matchCentreData"]['home']['name'], data["matchCentreData"]['away']['teamId']: data["matchCentreData"]['away']['name'] } players_home = pd.DataFrame(data["matchCentreData"]['home']['players']) players_away = pd.DataFrame(data["matchCentreData"]['away']['players']) players_home["teamId"] = data["matchCentreData"]['home']['teamId'] players_away["teamId"] = data["matchCentreData"]['away']['teamId'] players_df = pd.concat([players_home, players_away]) return events_dict, players_df, teams_dict if json_data: events_dict, players_df, teams_dict = extract_data_from_dict(data) pd.DataFrame(events_dict).to_csv('EventData.csv', index=False) players_df.to_csv('PlayerData.csv', index=False) df = pd.read_csv('EventData.csv') dfp = pd.read_csv('PlayerData.csv')Gather event-related data and player information into organized DataFrames. Next, ensure that this collected information is securely stored in CSV format files. Once saved, retrieve these CSV files to reload them into DataFrames for subsequent analysis. Filter the gathered events to focus exclusively on successful passes, modify the coordinates so they align with the dimensions of the pitch, and ready the data for effective visualization.
df['type'] = df['type'].str.extract(r"'displayName': '([^']+)") df['outcomeType'] = df['outcomeType'].str.extract(r"'displayName': '([^']+)") df['period'] = df['period'].str.extract(r"'displayName': '([^']+)") df_filtered = df[~df['qualifiers'].str.contains('Corner|ThrowIn')] df_filtered = df_filtered[(df_filtered['type'] == 'Pass') & (df_filtered['outcomeType'] == 'Successful')] df_filtered[['x', 'endX']] *= 1.05 df_filtered[['y', 'endY']] *= 0.68 df_filtered = df_filtered.merge(dfp, on='playerId', how='left') df_filtered[['x', 'y']] = df_filtered[['y', 'x']] df_filtered[['endX', 'endY']] = df_filtered[['endY', 'endX']] print(df_filtered.head())Refine and Organize Data: Identify essential data points, focus on successful passes, and modify their coordinates. Combine player statistics with event-related information. Filter passes according to team identifiers to distinguish between home and away team actions.
df['type'] = df['type'].str.extract(r"'displayName': '([^']+)") df['outcomeType'] = df['outcomeType'].str.extract(r"'displayName': '([^']+)") df['period'] = df['period'].str.extract(r"'displayName': '([^']+)") df_filtered = df[~df['qualifiers'].str.contains('Corner|ThrowIn')] df_filtered = df_filtered[(df_filtered['type'] == 'Pass') & (df_filtered['outcomeType'] == 'Successful')] df_filtered[['x', 'endX']] *= 1.05 df_filtered[['y', 'endY']] *= 0.68 df_filtered = df_filtered.merge(dfp, on='playerId', how='left') df_filtered[['x', 'y']] = df_filtered[['y', 'x']] df_filtered[['endX', 'endY']] = df_filtered[['endY', 'endX']] print(df_filtered.head())Filter Passes: This function is designed to extract successful passes for a given team. It utilizes libraries like matplotlib and mplsoccer to create visual representations of these passes. The draw_pass_map function is responsible for plotting the football pitch along with the pass data, providing a clear visual context for analysis.
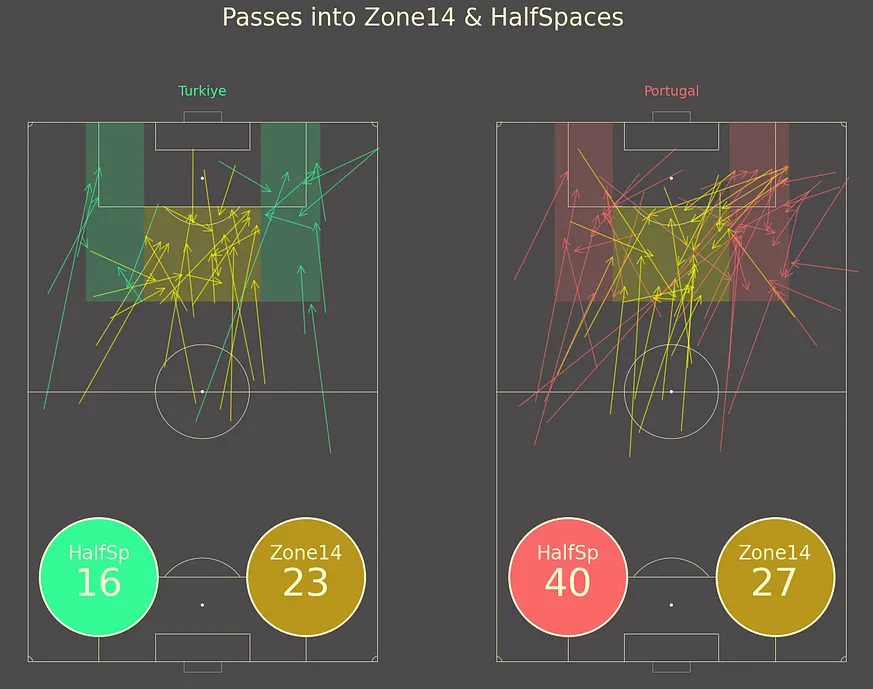
fig, axs = plt.subplots(1, 2, figsize=(16, 11), facecolor=black) def draw_pass_map(ax, df, title, col): pitch = VerticalPitch(pitch_type='uefa', pitch_color=black, line_color=white, linewidth=0.5, corner_arcs=True, goal_type='box', goal_alpha=.5) pitch.draw(ax=ax) ax.invert_xaxis() ax.set_facecolor(black) z14 = 0 hs = 0 for index, row in df.iterrows(): if row['endY'] >= 70 and row['endY'] <= 88.54 and row['endX'] >= 22.66 and row['endX'] <= 45.32: arrow = patches.FancyArrowPatch((row['x'], row['y']), (row['endX'], row['endY']), arrowstyle='->', alpha=0.65, mutation_scale=20, color='yellow', linewidth=1) ax.add_patch(arrow) z14 += 1 if row['endY'] >= 70 and row['endX'] >= 11.33 and row['endX'] <= 22.66: arrow = patches.FancyArrowPatch((row['x'], row['y']), (row['endX'], row['endY']), arrowstyle='->', alpha=0.65, mutation_scale=20, color=col, linewidth=1) ax.add_patch(arrow) hs += 1 if row['endY'] >= 70 and row['endX'] >= 45.32 and row['endX'] <= 56.95: arrow = patches.FancyArrowPatch((row['x'], row['y']), (row['endX'], row['endY']), arrowstyle='->', alpha=0.65, mutation_scale=20, color=col, linewidth=1) ax.add_patch(arrow) hs += 1 x_z14 = [22.66, 22.66, 45.32, 45.32] y_z14 = [70, 88.54, 88.54, 70] ax.fill(x_z14, y_z14, 'yellow', alpha=0.2, label='Zone14') x_rhs = [11.33, 11.33, 22.66, 22.66] y_rhs = [70, 105, 105, 70] ax.fill(x_rhs, y_rhs, col, alpha=0.2, label='HalfSpaces') x_lhs = [45.32, 45.32, 56.95, 56.95] y_lhs = [70, 105, 105, 70] ax.fill(x_lhs, y_lhs, col, alpha=0.2, label='HalfSpaces') z14name = "Zone14" hsname = "HalfSp" z14count = f"{z14}" hscount = f"{hs}" ax.scatter(13.85, 16.46, color=col, s=15000, edgecolor=white, linewidth=2, alpha=1, marker='o') ax.scatter(54.15, 16.46, color='#b8961b', s=15000, edgecolor=white, linewidth=2, alpha=1, marker='o') ax.text(13.85, 21, hsname, fontsize=20, color=white, ha='center', va='center') ax.text(54.15, 21, z14name, fontsize=20, color=white, ha='center', va='center') ax.text(13.85, 15, hscount, fontsize=40, color=white, ha='center', va='center') ax.text(54.15, 15, z14count, fontsize=40, color=white, ha='center', va='center') ax.set_title(title, color=col, fontsize=14) draw_pass_map(axs[0], dfhp, hteamName, hcol) draw_pass_map(axs[1], dfap, ateamName, acol) plt.suptitle(f'Passes into Zone14 & HalfSpaces', fontsize=25, color=white, y=1)Establish Subplots: Begin by creating a figure that includes two distinct subplots, one for the home team and another for the away team. Construct Pass Map: Develop a function designed to visualize passes on a football pitch, using color coding to differentiate and highlight specific regions. Include Annotations: Emphasize key areas such as "Zone 14" and "Half Spaces" with appropriate colors and labels for clarity. Title and Save: Assign titles to each subplot and ensure the overall figure is saved as an image file. Ultimately, export this visualization in PNG format for future reference.
plt.savefig(f'Passes_into_Danger_zone.png', bbox_inches='tight')Save the image: Preserve the graph as a PNG file for future use. The final result showcases the pass distributions occurring in Zone 14 and Half-Spaces:

References
The half-spaces: football tactics explained
The half-spaces are the two vertical lanes between the wide areas and the central lane. Sometimes, these five lanes are numbered: the ...
Source: The Coaches' Voice什麼是Half Space? | 浩看足球 - 球迷世界
當中路沒有空間之時,球場空間又再細分,衍生出half space這個界乎邊路與中路之間的位置,而這個空間之所以近年備 ...
Source: 球迷世界Half Spaces in Football: Analysis & Technichs
Half spaces refer to the areas between the edge of the penalty box on either side of the pitch towards the D as shown below. These areas are often referred to ...
Source: Football DNAA Beginners Guide to the Half-Spaces in football | by SamHoleAFC
The half-spaces are zones that allow creative players to have access to more dangerous angles, and ...
Source: Medium · SamHoleAFCHalf-space: football tactics explained
The half-spaces are considered to have the in-possession advantages of the centre zone, with the added ...
Source: FourFourTwoTactical Theory: Half-space combinations
Deriving from the German word “Halbraum,” half-space is the vertical zone between the central and wide areas. It has entered the football ...
Source: Total Football AnalysisTactical Theory: Using the half-spaces to progress the ball
Using the half-spaces gives teams a way of playing passes, at an angle, into areas of the pitch they might not be able to ...
Source: Total Football Analysis» The Half-Spaces
For positions in the half-spaces, however, the fields of view are not vertical, but diagonal. A player in the half-space has as many options as ...
Source: Spielverlagerung.com


 ALL
ALL sports
Discussions